
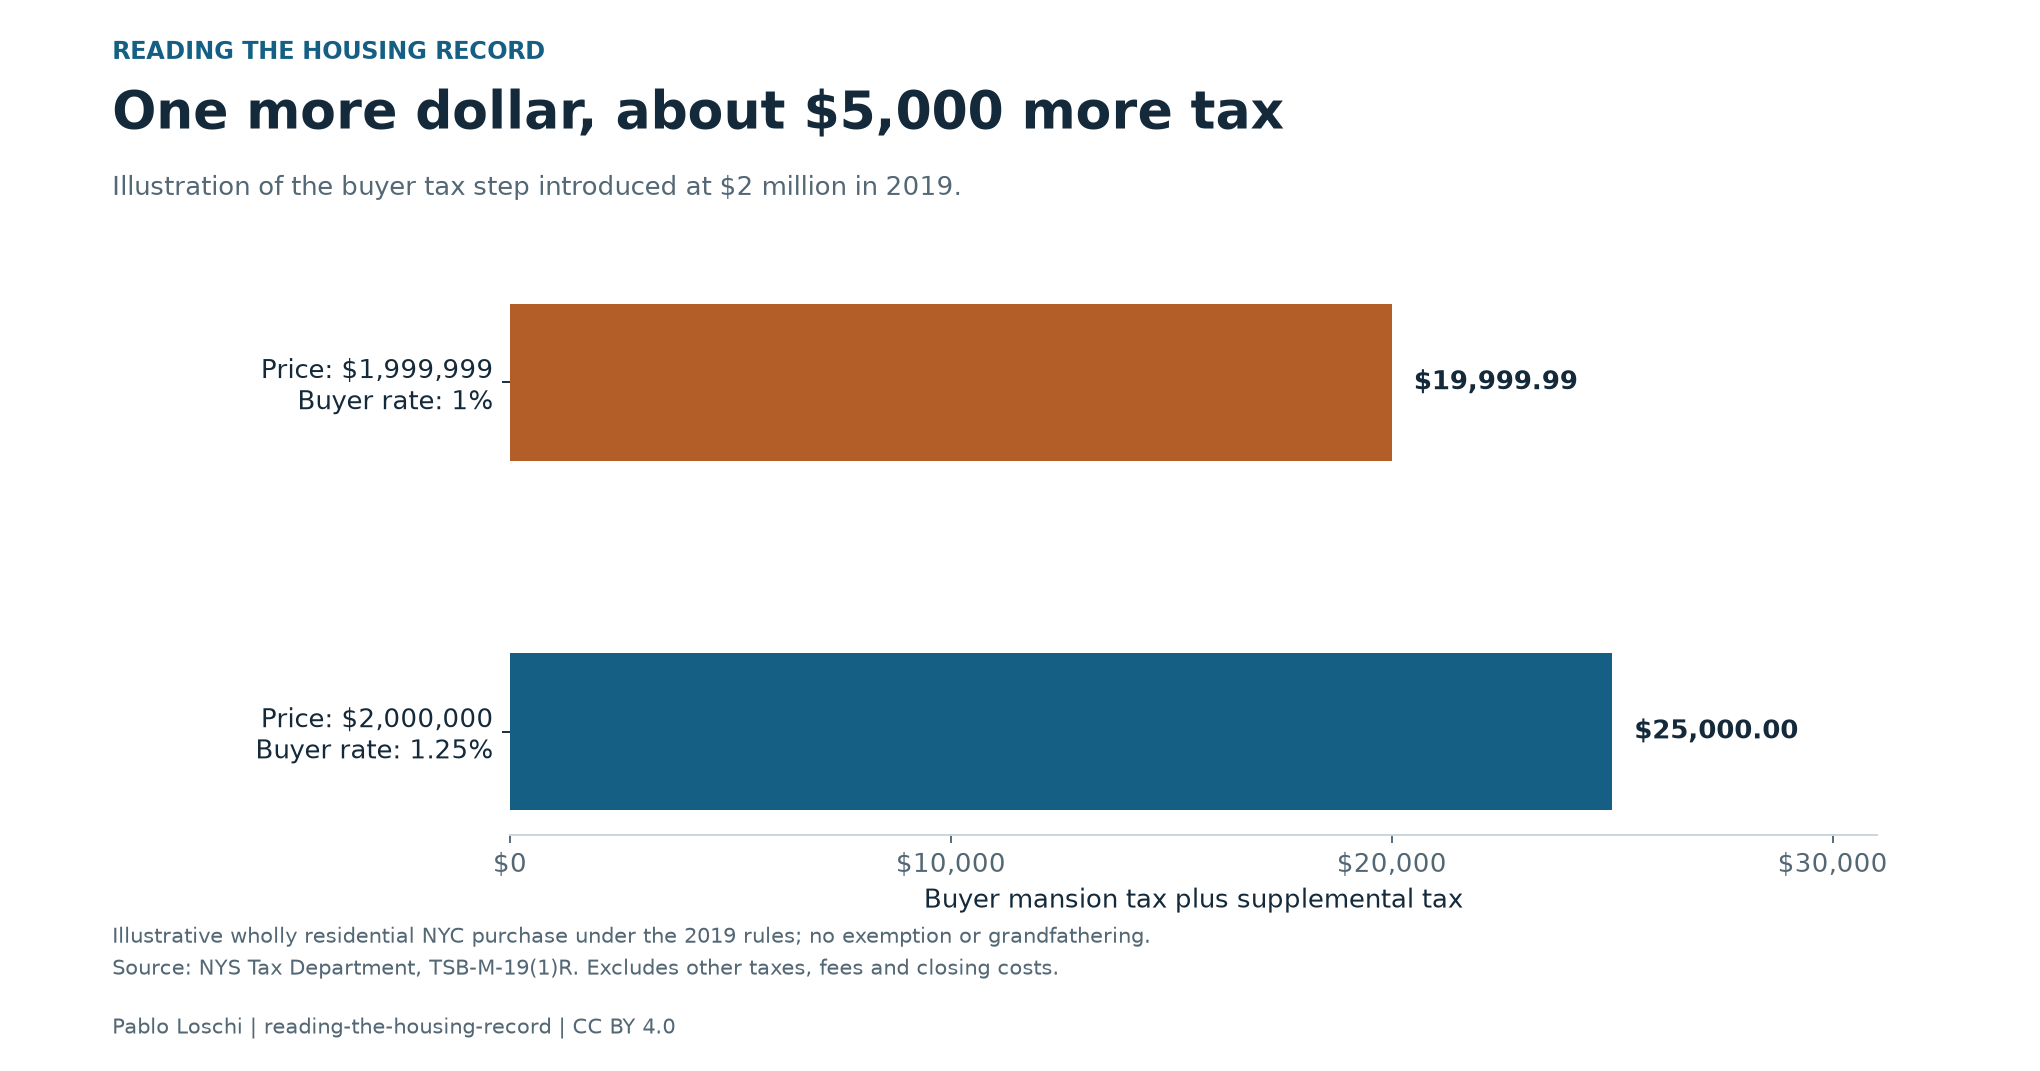
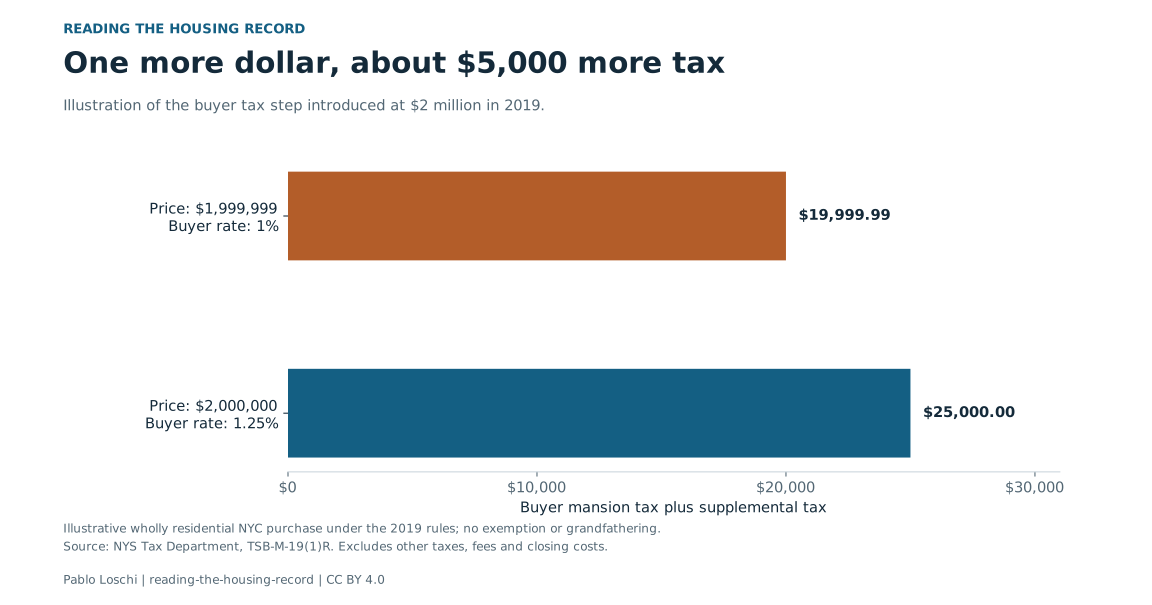
A New York City home priced at $1,999,999 sits one dollar below a costly line. Under the buyer tax rules introduced in 2019, reaching $2 million adds about $5,000 to the bill.
The higher rate applies to the whole purchase price. That is why a one-dollar price change can add thousands in tax.
My analysis of the city's residential sales records finds that transactions shifted toward prices below the new threshold after the reform. Sales recorded at exactly $1,999,999 went from four in January 2016 through March 2019 to 131 in January 2020 through December 2025.
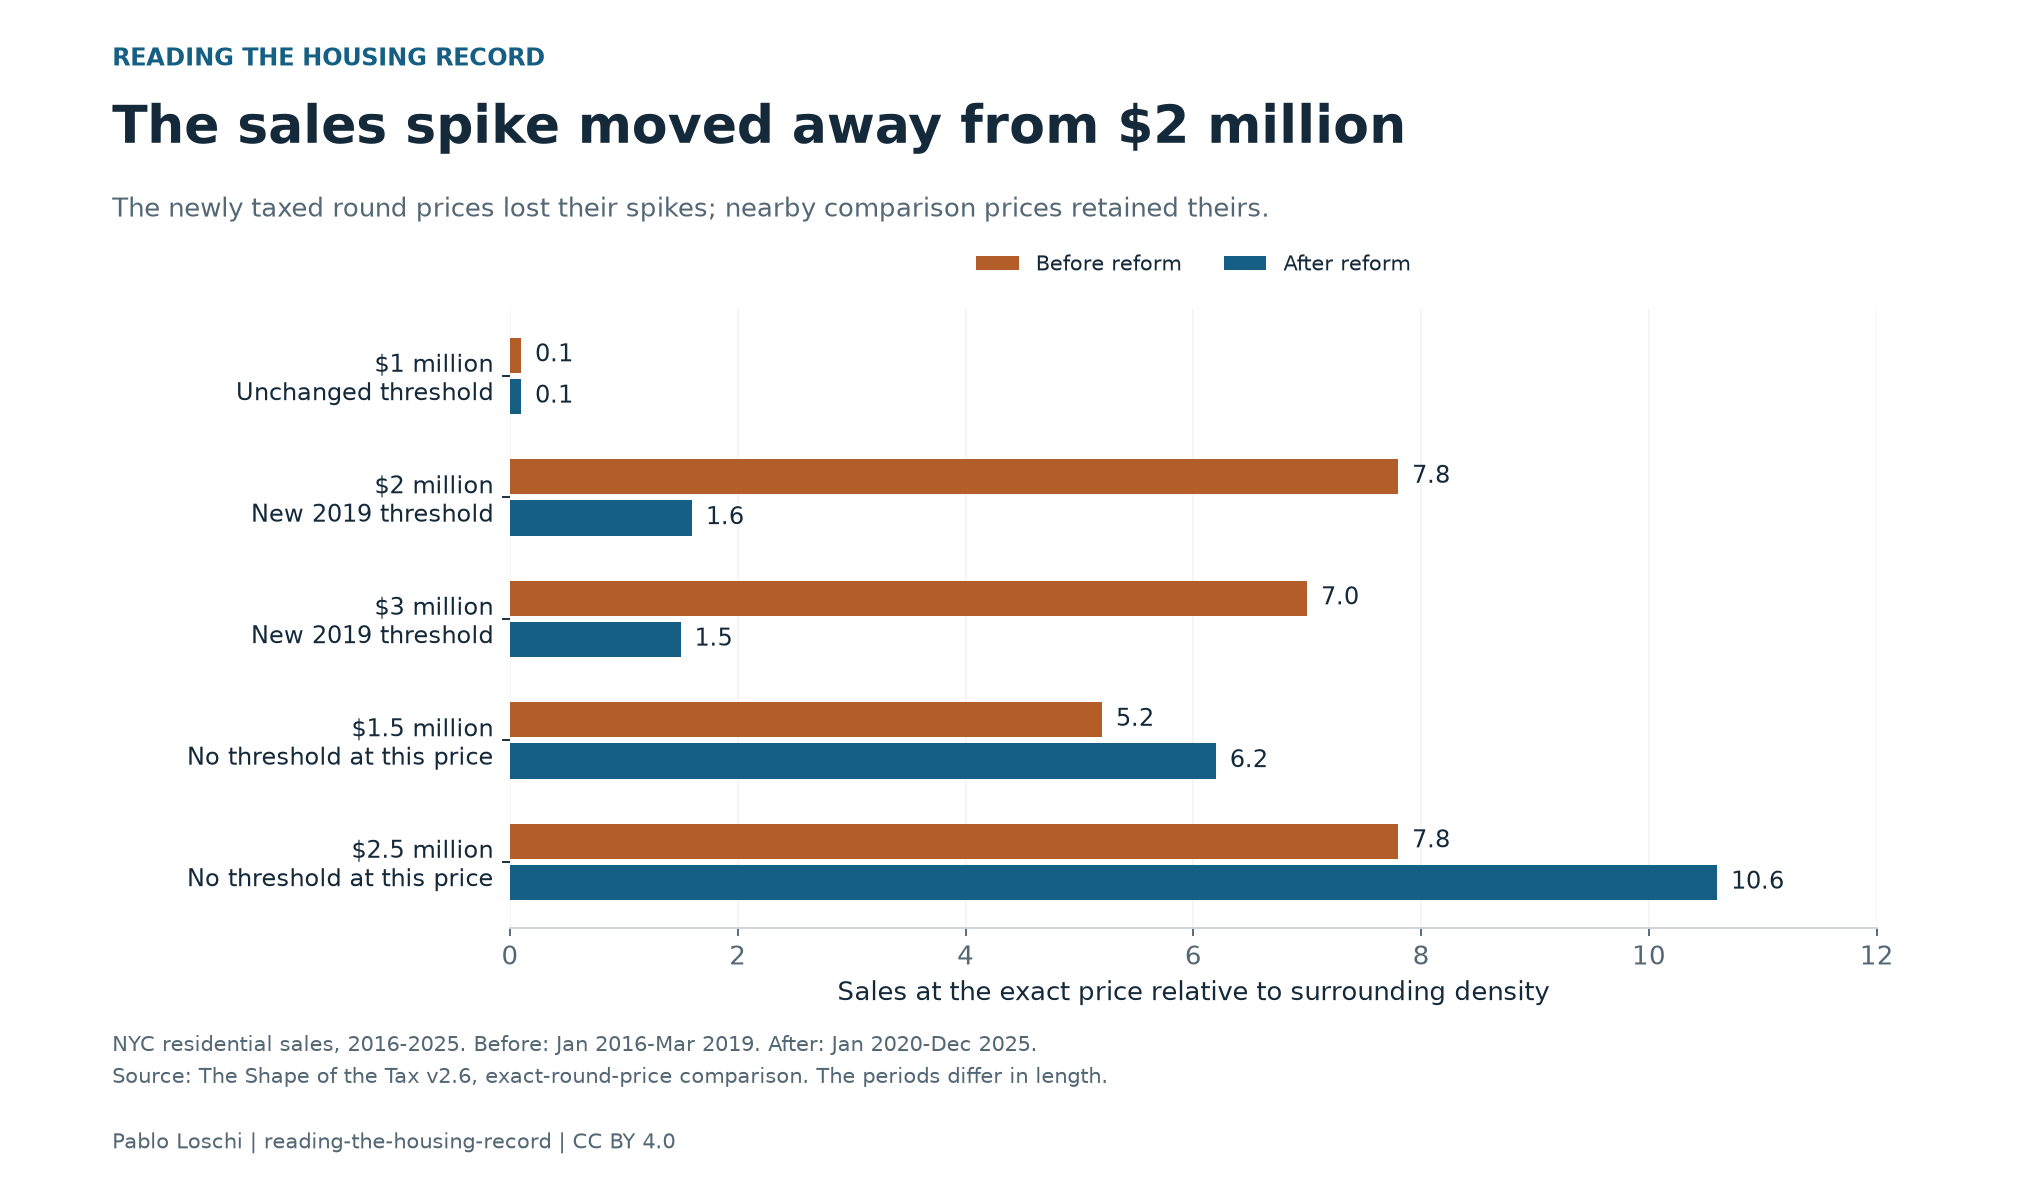
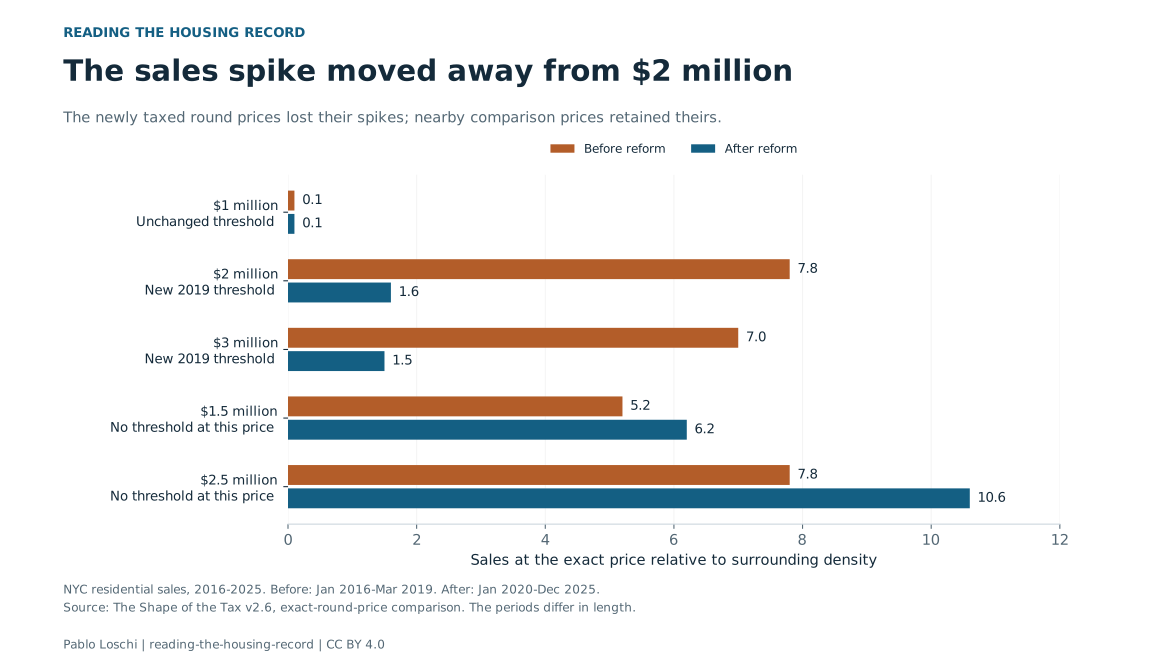
Those periods differ in length. The stronger comparison looks at each exact price relative to the density of sales around it. Before the reform, sales at exactly $2 million were 7.8 times the surrounding density. Afterward, that ratio was 1.6.
Read the chart data as a table
| Price | Before (ratio) | After (ratio) |
|---|---|---|
| $1 million | 0.10 | 0.10 |
| $2 million | 7.80 | 1.60 |
| $3 million | 7.00 | 1.50 |
| $1.5 million | 5.20 | 6.20 |
| $2.5 million | 7.80 | 10.60 |
The cost of crossing the line
For a wholly residential purchase without an exemption, the buyer's mansion tax and supplemental tax total $19,999.99 at a price of $1,999,999. At $2 million, they total $25,000. Other taxes and closing costs sit outside this illustration.
The supplemental tax took effect on July 1, 2019, with a grandfathering rule for certain earlier contracts. The comparison leaves out the transition period and starts the later sample in January 2020.
Buyers and sellers have a reason to settle below the tax line. The records show prices shifting there after the reform, although they cannot reveal what happened in each negotiation.
Interactive illustration · historical 2019 rules
What does the last dollar add?
Under the 2019 rules, the last $1 adds $5,000.01 in buyer tax at this line.
| Schedule | Tax below | Tax at line | Increase |
|---|---|---|---|
| Before 2019 reform | $19,999.99 | $20,000.00 | $0.01 |
| 2019 rules | $19,999.99 | $25,000.00 | $5,000.01 |
Wholly residential NYC conveyance, without exemption or grandfathering. Buyer mansion and supplemental taxes only; seller transfer taxes, mortgage recording tax and other closing costs are excluded. The new schedule applies from 1 July 2019, subject to the rule for qualifying contracts made on or before 1 April 2019. This explains the historical thresholds studied in the paper; it is not a current closing-cost quote. Source: NYS Tax Department, TSB-M-19(1)R. Amounts are rounded to cents.
Original $2 million graphic and downloads
Read the chart data as a table
| Sale price | Buyer rate (%) | Buyer tax ($) |
|---|---|---|
| 1,999,999 | 1 | 19,999.99 |
| 2,000,000 | 1.25 | 25,000 |
What happened at other round prices?
Round prices attract transactions even without a tax threshold. Before 2019, exactly $2 million and exactly $3 million were prominent price points. The reform made both the first dollar of a higher buyer-tax tier.
The spike at $3 million also fell, from 7.0 times the surrounding density to 1.5. Nearby round prices that did not become thresholds behaved differently. The ratio at $1.5 million rose from 5.2 to 6.2, and the ratio at $2.5 million rose from 7.8 to 10.6.
The $1 million threshold, which already existed, provides another comparison: its ratio stayed at about 0.1 in both periods. These comparisons help separate the response at new tax lines from changes in round-number pricing more generally.
The paper also compares years around the reform and examines houses and condominiums separately. The response begins with the reform and remains when foreclosure and lender transfers are removed. Those checks make the timing more persuasive, although they do not turn the exercise into a randomized experiment.
Reading a comparable near $2 million
A sale recorded just below the line may reflect a response to the tax step. Someone valuing a nearby home still needs the property details and the terms of the transaction. These records cannot say whether a particular deal reached that amount through a price negotiation, a credit or another arrangement.
I would welcome accounts from appraisers, brokers and buyers who have dealt with this boundary. Write to me about what happened at the table; identifying details need not be included.
An extra tax for buyers who need a mortgage
For house and condo buyers, the price threshold is only part of the tax bill. New York City also charges a mortgage recording tax. A purchase made without a mortgage avoids that charge; a buyer who needs to borrow faces it in addition to the taxes on the transfer. Financing secured by co-op shares falls outside this illustration.
In the paper’s 2016–2025 financed sample, applying the standard borrower schedule to recorded loans gives a gross mortgage charge averaging 1.41% of the purchase price for houses and 1.28% for condominiums. These are calculated charges before credits, exemptions and consolidation adjustments, not observed tax payments. The City’s mortgage recording tax guidance explains the recording requirement and exceptions.
For a buyer who needs a mortgage, that raises a fairness question: should borrowing to buy a home trigger a charge that an otherwise comparable cash purchase avoids? The paper measures the statutory difference. It cannot tell us how much ultimately falls on buyers through closing costs, sellers through prices, or lenders through loan terms.
What a different tax schedule would change
The result concerns the shape of a transaction-tax schedule. A charge on the whole price creates a sudden step at the boundary. A charge confined to the portion above a threshold would have a different structure. This study does not estimate how buyers would respond to a replacement schedule.
It also does not measure the government's lost receipts. Calculations that treat extra sales below a threshold as transactions moved from above it depend on that assumption. Nor do sale records reveal whether buyers, sellers or intermediaries ultimately bear the cost.
Sources and methods
This article explains Pablo Loschi's own research. The chart series are retained in version 2.7. That release adds transaction counts and composition checks around the reform; those comparisons remain descriptive. Read the paper. All versions on Zenodo.
Paper and replication files used for this story.
The tax illustration uses the NYS Tax Department’s June 2019 memorandum, TSB-M-19(1)R. It illustrates the historical buyer tax step, not all closing costs.
New article text and original graphics: CC BY 4.0. Credit Pablo Loschi, Reading the Housing Record; retain the source and sample, and identify edits. Underlying research releases retain their own terms.