
A house sells twice. The buyer with a mortgage pays more than the buyer recorded as paying cash. How much of that difference is a discount for a more certain closing?
The records cannot answer that from the financing label alone. The cash group includes company buyers and possible transfers between relatives. It can also include purchases whose mortgages the matching rule missed.
My comparison of New York City repeat sales from 2016 to 2025 puts the financed-minus-cash price gap for houses at 9.25 log points, roughly 9.7%. That comparison does not tell us what would happen to a particular sale if the buyer changed payment method.
Exclude the 358 repeat-sale pairs involving a deed where buyer and seller share a surname, and the estimate falls to 4.87 log points. The surname screen removes about half the measured gap.
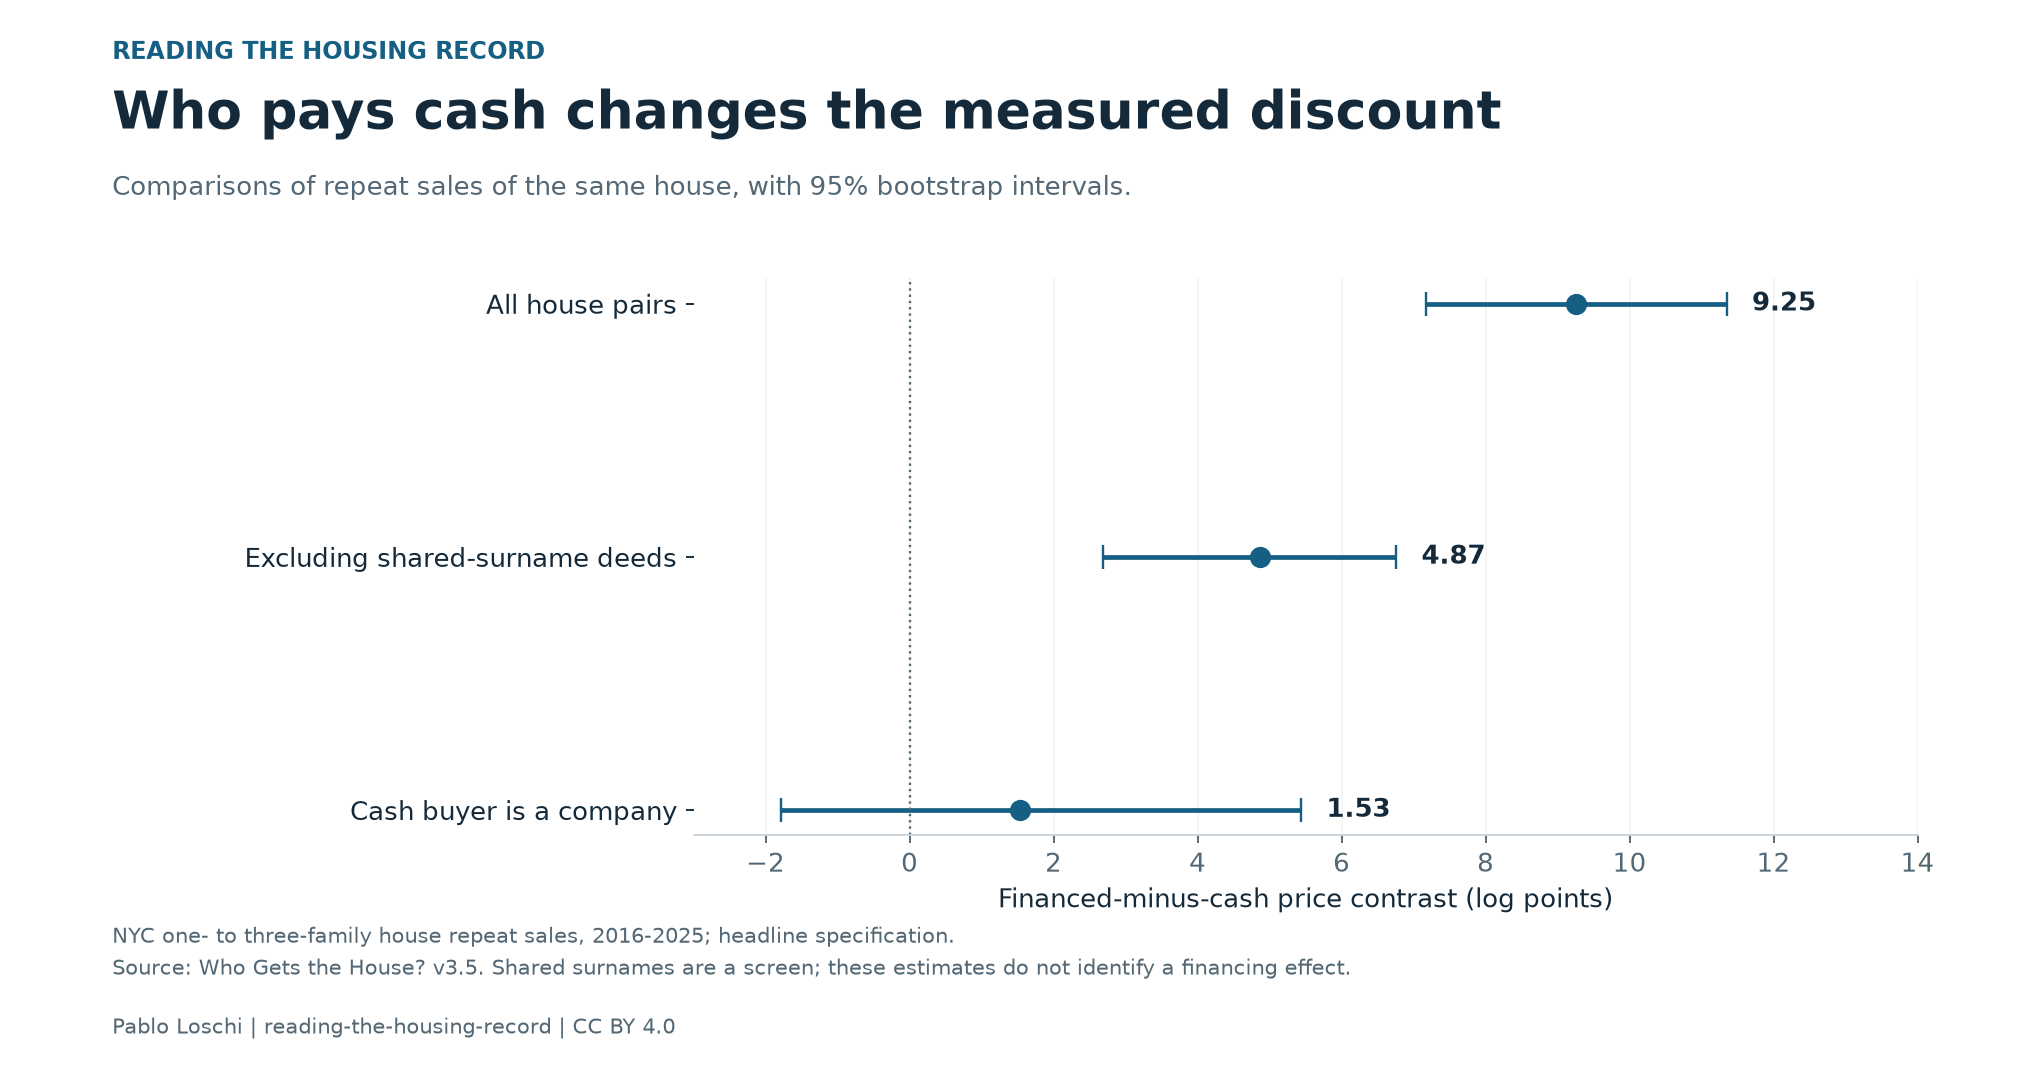
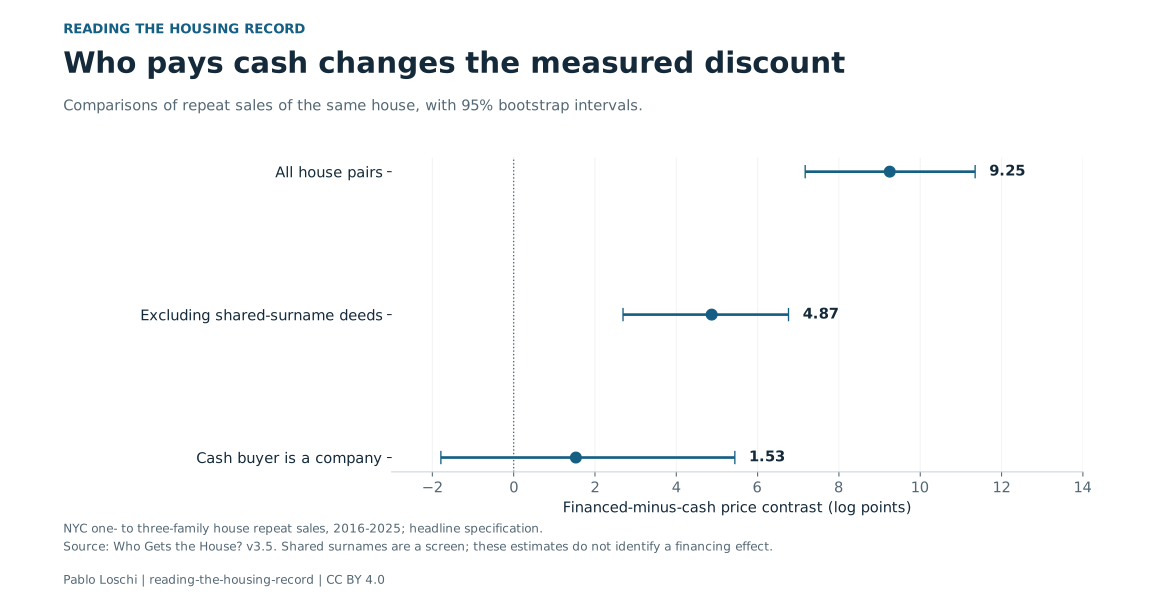
Read the chart data as a table
| Sample | Estimate (log points) | 95% lower | 95% upper |
|---|---|---|---|
| All house pairs | 9.25 | 7.17 | 11.35 |
| Excluding shared-surname deeds | 4.87 | 2.69 | 6.76 |
| Cash buyer is a company | 1.53 | -1.79 | 5.44 |
Who is in the cash group?
A shared surname can point to a transfer between relatives. Unrelated people can also share a name, and relatives can have different names. Excluding this reproducibly identified group changes the estimate substantially; that change does not identify how much family transfers cause the original gap.
Company buyers tell a different story. When the cash buyer is a company, the estimated gap is 1.53 log points. Its 95% interval runs from minus 1.79 to plus 5.44, so these records do not pin down a positive gap for that group.
Some company buyers are individuals buying through an LLC. The name alone tells us little about their resources or the certainty of their offer, and it does not establish that they are large institutional investors.
The study compares repeat transactions in the same property, which helps account for features that stay fixed. It cannot remove every difference between the transactions. Renovations, conditions of sale and other changing circumstances can still affect prices.
Finding a mortgage is a separate problem
The financing label comes from matching a sale to mortgages recorded against its parcel near the sale date. That is a useful way to assemble a large dataset, but a nearby mortgage does not automatically establish purchase financing. The borrower, collateral and purpose of the loan need to fit the purchase.
The absence of a match is also inconclusive. A loan can cover more than one lot, appear under an unexpected date or be missed by the rule. In the review of 53 repeat-sale pairs, four of the 50 sampled cash labels had a same-day purchase mortgage. Two involved dates in the City's index that were a year off; two involved adjoining lots.
The review used AI readings of the instruments followed by an AI cross-check against City records. It is a consistency check with the limitations documented in the paper. It does not verify every cash label or supply an independent accuracy rate for the full sample.
How much the result depends on errors
Dropping the four pairs with documented label errors leaves the headline estimate at 9.40 log points. Version 3.5 also tests errors in both directions across the larger sample. The assumed random error scenarios reduce the gap without reversing it. The reviewed set combines random and targeted cases, so its pooled counts do not estimate error rates in the full population.
Errors concentrated on the pairs whose price changes work against the result could reverse it. The document review is too small to rule out that pattern. With the documented corrections and screens applied together, the estimate is 5.19 log points, with a 95% interval of 2.98 to 7.18.
A targeted follow-up found three bundle prices covering multiple parcels and four mortgages with index dates that contradict their operative pages. Applying rules for those problems across the sample gives a 9.91-log-point contrast. That is a sensitivity exercise, conditional on those rules. The deed cross-reference has since been resolved as a power of attorney.
Before using a cash discount to judge an offer or argue for a tax, check which transactions went into it. The gap changes substantially when possible family transfers are removed. These records leave the value of closing certainty unresolved.
Sources and methods
This article explains Pablo Loschi's own research. The headline estimates and chart are retained in version 3.6. The new stratified random sample of 40 sale endpoints identifies two missed mortgages: correcting those labels moves the headline contrast from 9.25 to 9.23 log points. Eighteen sampled cases remain unresolved, so this is a sensitivity check rather than a verified population error rate. Read the paper. All versions on Zenodo.
Paper and replication files used for this story.
New article text and original graphics: CC BY 4.0. Credit Pablo Loschi, Reading the Housing Record; retain the source and sample, and identify edits. Underlying research releases retain their own terms.